I recently noticed on a production deployment that it had frequent full garbage collection cycles with only around 50% of heap utilizations. This could happen because of several reasons and here I will be explaining the reason behind this particular observation and some of my findings in this area. I had to intrigue some of the sun classes. While some googling I found them located at docjar . Hence I am not really sure of the version, and if these observations will be valid in future. Its all tested and verified on latest java version 1.6.0 update 22.
Object Accessors
An object is accessed using reflection in three ways :
1. An object is either initialized by calling newInstance method on the Class object. This needs a Constructor Accessor.
2. An object is accessed for its Methods which invloves a Method Accessor.
3. An object is accessed for its Fields which envolves a Field Accessor.
The field of an object is accessed using an instance of the Field class which internally involves a Field Accessor. The Field Accessor involves the unsafe object which in turn uses Atomic apis to access (get/set) the fields of an object. These are kind of direct memory operations through the virtual machine. We wont be discussing the Field Accessors in details.
Different type of accessors
The method accessor and constructor accessors are either native or generated. This means that either we use NativeMethodAccessorImpl or GeneratedMethodAccessor for Methods and NativeConstructorAccessorImpl and GeneratedConstructorAccessor for Constructors.
The accessor would be a native or generated and is controlled and decided by two system properties.
1. -D sun.reflect.noInflation = false (default value is false)
2. -D sun.reflect.inflationThreshold = 15 (default value is 15)
When the sun.reflect.noInflation is set to true then the accessor used will always be generated and there is no meaning for the system property sun.reflect.inflationThreshold. When the sun.reflect.noInflation is false and the sun.reflect.inflationThreshold is set to 15 (thats the default behavior if not specified) then it means that for the first 15 accesses to the constructor (or methods), a native generator will be used and thereafter a generated accessor will be supplied (from ReflectionFactory) for use.
The Native accessor uses native calls to access information, whereas the generated accessor is all byte code and hence very fast. On the other hand generated accessor needs time to instantiate and load (basically inflates and hence the system properties controlling it has names including 'inflation' word). Following is the extract which I found on a source file at docjar :
"Inflation" mechanism. Loading bytecodes to implement Method.invoke() and Constructor.newInstance() currently costs 3-4x more than an invocation via native code for the first invocation (though subsequent invocations have been benchmarked to be over 20x faster). Unfortunately this cost increases startup time for certain applications that use reflection intensively (but only once per class) to bootstrap themselves. To avoid this penalty we reuse the existing JVM entry points for the first few invocations of Methods and Constructors and then switch to the bytecode-based implementations."
Generated Accessors
Generated accessors for constructors and methods behave the same and are treated in a similar manner, hence here forth I will talk about constructor accessors and everthing about them is applicable to method accessors as well.
The generated accessors are the objects of the classes generated during runtime. The name of a generated accessor's class would look something like "sun.reflect.GeneratedConstructorAccessor11" or "sun.reflect.GeneratedSerializationConstructorAccessor12". These are kind of runtime proxies used by reflection to access object information which is stored in the memory. These accessors are cached so that they dont have to be regenerated each time. for e.g. ConstructorAccessors are cached in a given Constructor of a Class Object. These class objects are singleton per classloader, and hence we have only one instance of a generated accessor per classloader of a given Class. This means that we would have same number of accessors as the number of classes present in the deployment. Same goes for the method accessors as well. All these classes reside in the permgen and hence we need to make sure that the size of our permanent generation (perm gen) is large enough to accomodate these classes. These generated accessors are created lazily on demand and hence an application using reflection heavily and widely would need a larger permanent generation.
If the perm gen size is less and our application uses a lot of relection code then over the time perm gen can explode and hence one can get a OutOfMemoryError. Hence for this reason (probably) serialization deserialization process uses an ObjectOutputStream which relies on ObjectStreamClass to get these accessors. There is one ObjectStreamClass instance per Class object present in the VM. These instances of ObjectStreamClass are cached inside this class itself by soft references. Hence when the perm gen reaches a its limit the garbage collector runs and clears all these soft references, thereby unloading these dynamically generated classes from the virtual machine. These classes are recreated and loaded back into the virtual machine when they are again accessed during serialization and deserialization process.
This behaviour of loading and unloading of dynamically generated classes is frequent and evident in applications involving heavy use of serialization and deserialization (rmi client server model or any kind of non-web client server application or jms based application). The unloading is done when the perm gen is under memory pressure and garbage collection runs and clears the soft references to the ObjectStreamClass.
In a nutshell, when talking about an application using reflection and serialization-deserialization widely (widely refers to, using across most of the classes, and not limited to heavy usage on few classes), we could get an OutOfMemoryError. This could be avoided by increasing the perm size, but in the later case of serialization-desrialization a frequent GC in perm space could be observed. This is due to the clearance of the soft references to ObjectStreamClass objects, becuase of the memory pressure on perm space. An optimum perm size would not see frequent full garbage collection cycles without memory pressure and hence would not see frequent unloading of classes.
Generally in such a scenario, virtual machine spits out log messages such as :
Unloading class sun.reflect.GeneratedSerializationConstructorAccessor1
Unloading class sun.reflect.GeneratedSerializationConstructorAccessor2
Unloading class sun.reflect.GeneratedSerializationConstructorAccessor3
....
Ofcourse this problem could be avoided by increasing the size of the perm gen, but you really dont know how much and this is learnt by regularly profiling the application till you see no frequent unloading of generated classes in perm gen. (I used yourkit profiler to observe this behaviour).
I wrote a simple java class using the compiled sources of the sun classes I got from docjar. Basically I generated Constructor Accessors in a loop, that means continously generating dynamic classes at runtime. I profiled this run and took a few screenshots from the yourkit profiler.
My Java code looked like following :
____________________________________________________________________
public class Test implements Serializable {
public static void main(String[] args) throws Exception {
while(true) {
ReflectionFactory1 reflectionFactory = ReflectionFactory1.getReflectionFactory();
ConstructorAccessor constructorAccessor = reflectionFactory.newConstructorAccessorDummy(Test.class.getDeclaredConstructor(null));
constructorAccessor.newInstance(null);
System.out.println(constructorAccessor.getClass().toString());
}
}
}
____________________________________________________________________
ReflectionFactory1 has the same source code as ReflectionFactory except a new method :
____________________________________________________________________
public ConstructorAccessor newConstructorAccessorDummy(Constructor
return new MethodAccessorGenerator().generateConstructor(c.getDeclaringClass(), c.getParameterTypes(), c.getExceptionTypes(), c.getModifiers());
}
____________________________________________________________________
ReflectionFactory1 was created in the package sun.refelect (in order to compile it) and was included in bootstrap class loader in order to run the Test app. The JVM parameters were as follows :
-Dsun.reflect.inflationThreshold=15
-Dsun.reflect.noInflation=true
-Xbootclasspath/a:./classes/java
-Xmx32m
-Xms32m
-XX:PermSize=6m
-XX:MaxPermSize=6m
-agentpath:"C:\Program Files\YourKit Java Profiler 9.0.5\bin\win32\yjpagent.dll"
Below is the snapshot from the yourkit. The non-heap memory graph in the center represents the permanent generation. Here as we see, because of memory pressure on perm gen, frequent full GC cycles occurs. This leads to regular unloading of generated classed as seen in the graph on the right.

Below graph shows the time spent in full GC is regular but less. This is due to the fact that we dont have any application objects and the heap is very small. Imagine in a real application with large heap and lots of application objects, the frequent garbage collection will mean frequent scanning of large filled heap and hence would be costly in terms of time and CPU.
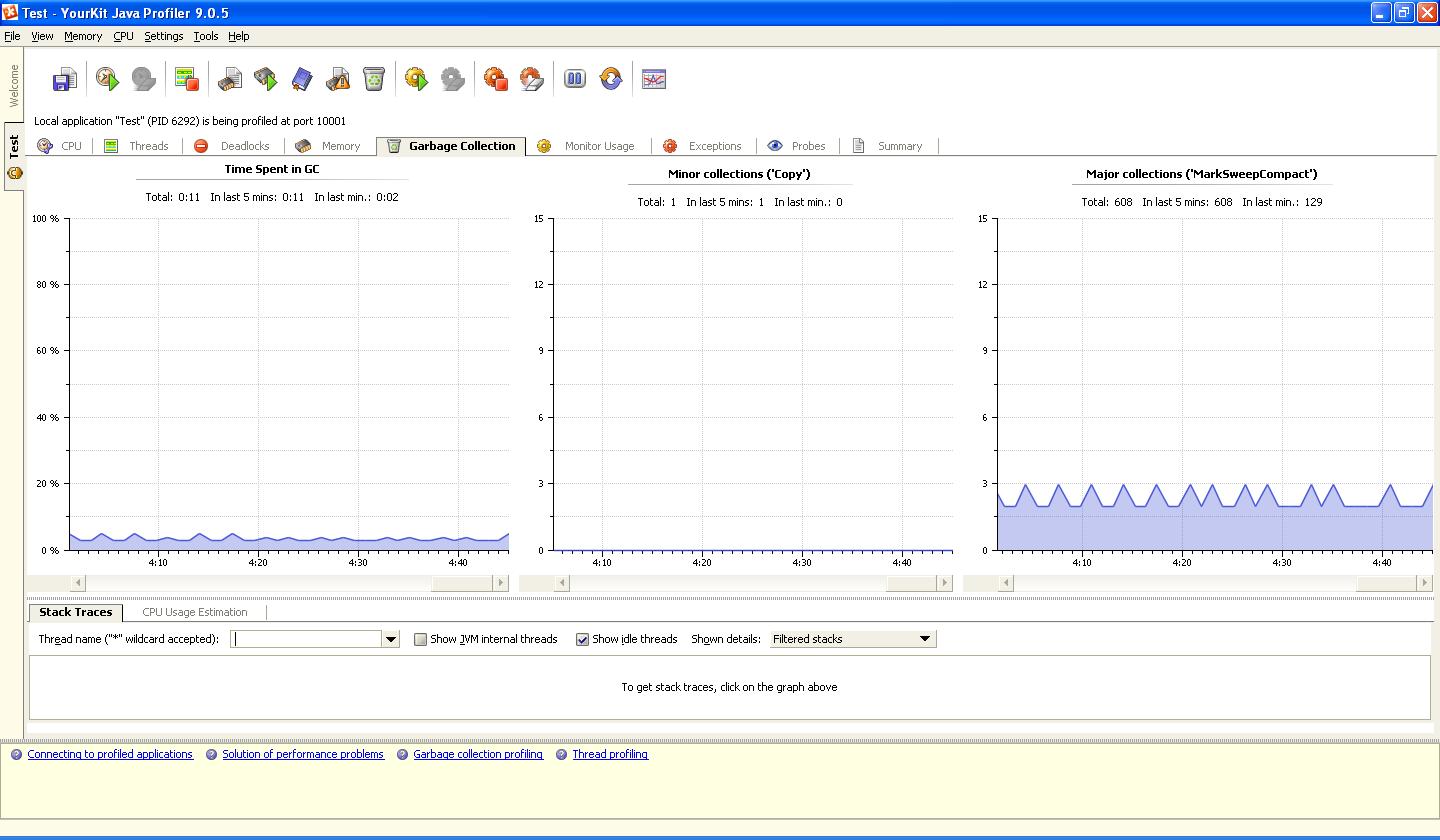
In the graph shown below, CPU utilization is about 50%. This is due to the infinite while loop. As discussed, in case of large heap and more application objects, this kind of high CPU utilization could also come from GC activity .

Finally, I would suggest not to ignore perm gen and monitor it. As seen, the frequent GCs without full memory of the heap being used, could result in high CPU utilization. This could also cause continouus jitters in an application.
23 comments:
I am facing permmen problems in my application, which is mainly used by generatedMethodAccessors. I've set the noInflation to false and set inflationTreshold to 0 and still see those being loaded and cloging up permgen space
Hi Anshuiitk,
Thanks for sharing information around garbage collection, I have one question which you may be able to answer "Does Garabge collection happens in Perm Area of Heap ? if yes on which scenario it happens ?"
Thanks in advance
Javin
What is the problem while using "==" in autoboxing world in Java 5 ?
@Javin : Garbage collection is a heap wide phenomena and cannot be localized to perm gen. That said, when a full GC happens, it does scan perm gen along with the rest of the heap and may clear it partially by unloading some generated classes, to provide perm gen some breathing space.
On the other hand as explained in the article, the memory pressure due to the generated classes in the perm gen may produce undesired Full GC Cycles.
We have faced with the same problem at production, thank you very much for good explanation and recommendations, you have helped us so much.
Thanks Ken, Glad to know that you benefited from the post.
Hi Anshuiitk, long time no post man , how are you ? please keep posting. I have also written my views on GC as How Garbage collection in java let me know how do you find it.
Javin
Hi Anshu, I am facing almost similar problem of OOM (sometimes Perm but mostly heap) .. but always before OOM there are lots of Unloading class sun.reflect.GeneratedMethodAccessor or GeneratedConstructorAccessor logs.. I analyzed heap dump and found there are almost 350 classloaders everytime (see below stats from netbeans). I checked the code and found that there are many files where code like this is used:
InputStream stream = Config.class.getClassLoader().getResourceAsStream(CONFIG_FILE_CLASSPATH);
Thanks in advance
-------------------
Total bytes: 3,092,011,595
Total classes: 6,274
Total instances: 14,917,573
Classloaders: 332
GC roots: 2,667
Number of objects pending for finalization: 0
What are your thoughts about the garbage collection in Brampton? Thanks for sharing this!
This is great. You really know your stuff. I work with garbage disposal in Brampton but i just started. How long have you been doing this for?
Thanks for sharing. Was helpful information :-)
I have come across a GCeasy tool http://gceasy.io for GC log analysis. It is pretty good with insights and graphs.
Hi Anshu,
I am using JRockit R28.2.5 . I am getting OutOfMemoryError because the ClassBlockMemory if full.
In the summary of the loaded classes, I found that the GeneratedSerializationConstructorAccessor, Method Accessor objects are increasing. But as you had mentioned , these objects are created only once per class per classloader. So, how can we find the reason behind their increase? Are they not being cached?
Hi Anshu,
We are using Java 8 and we have a metaspace configured to 1024m. We have been getting OOME:metaspace errors. The behavior you explained on permgen, will it apply to the metaspace as well? i see there are lots of method accessor and constructor accessor classes being created in the heap dump and there is always a full GC happening in the production and the server is throwing OOME:metaspace in every 7-8hr.
Thanks for sharing informative information. We also offer these services at affordable price.
Loading unloading
Loadinggadi in indore
Choose Trucking Cube cheap Moving service at cheap cost. Because we are the best cheap moving service providers in India. We have all the things that make your relocation a lot safer and easier. If anybody needs our service then go to our website and you can directly contact us.
Freight Forwarding Quote
Moving and Storage Companies
news portal development company
opencart development company delhi
its been long since i saw a post that's so educative and informational. i will make sure to share this my facebook group. you can also view contents on our websites below.
French Bulldog Puppies For Sale
French Bulldog Breeders
French Bulldog Puppies For Sale Near Me
French Bulldog Puppies For adoption
French Bulldog Puppies
Blue French Bulldog Puppies
I liked your blog. Thanks for your interest in sharing your ideas. keep doing more.
Buy Instagram Followers India
They are really nice content shared! I like your blog post. Thanks for sharing nice information. Digital Agency In India
Python Django online classes help learners master backend development remotely.They focus on guided practice.This Python Django online classes build confidence.They are useful.
Impressive explanation. The platform creates a balance between guidance and flexibility.
It allows users to explore while still staying on the right path cost of studying in UK for Indian students 2026
The great website and information shared are also very appreciable. high demand courses in Canada for PR
Post a Comment